Federal Budget Operate Plan Model
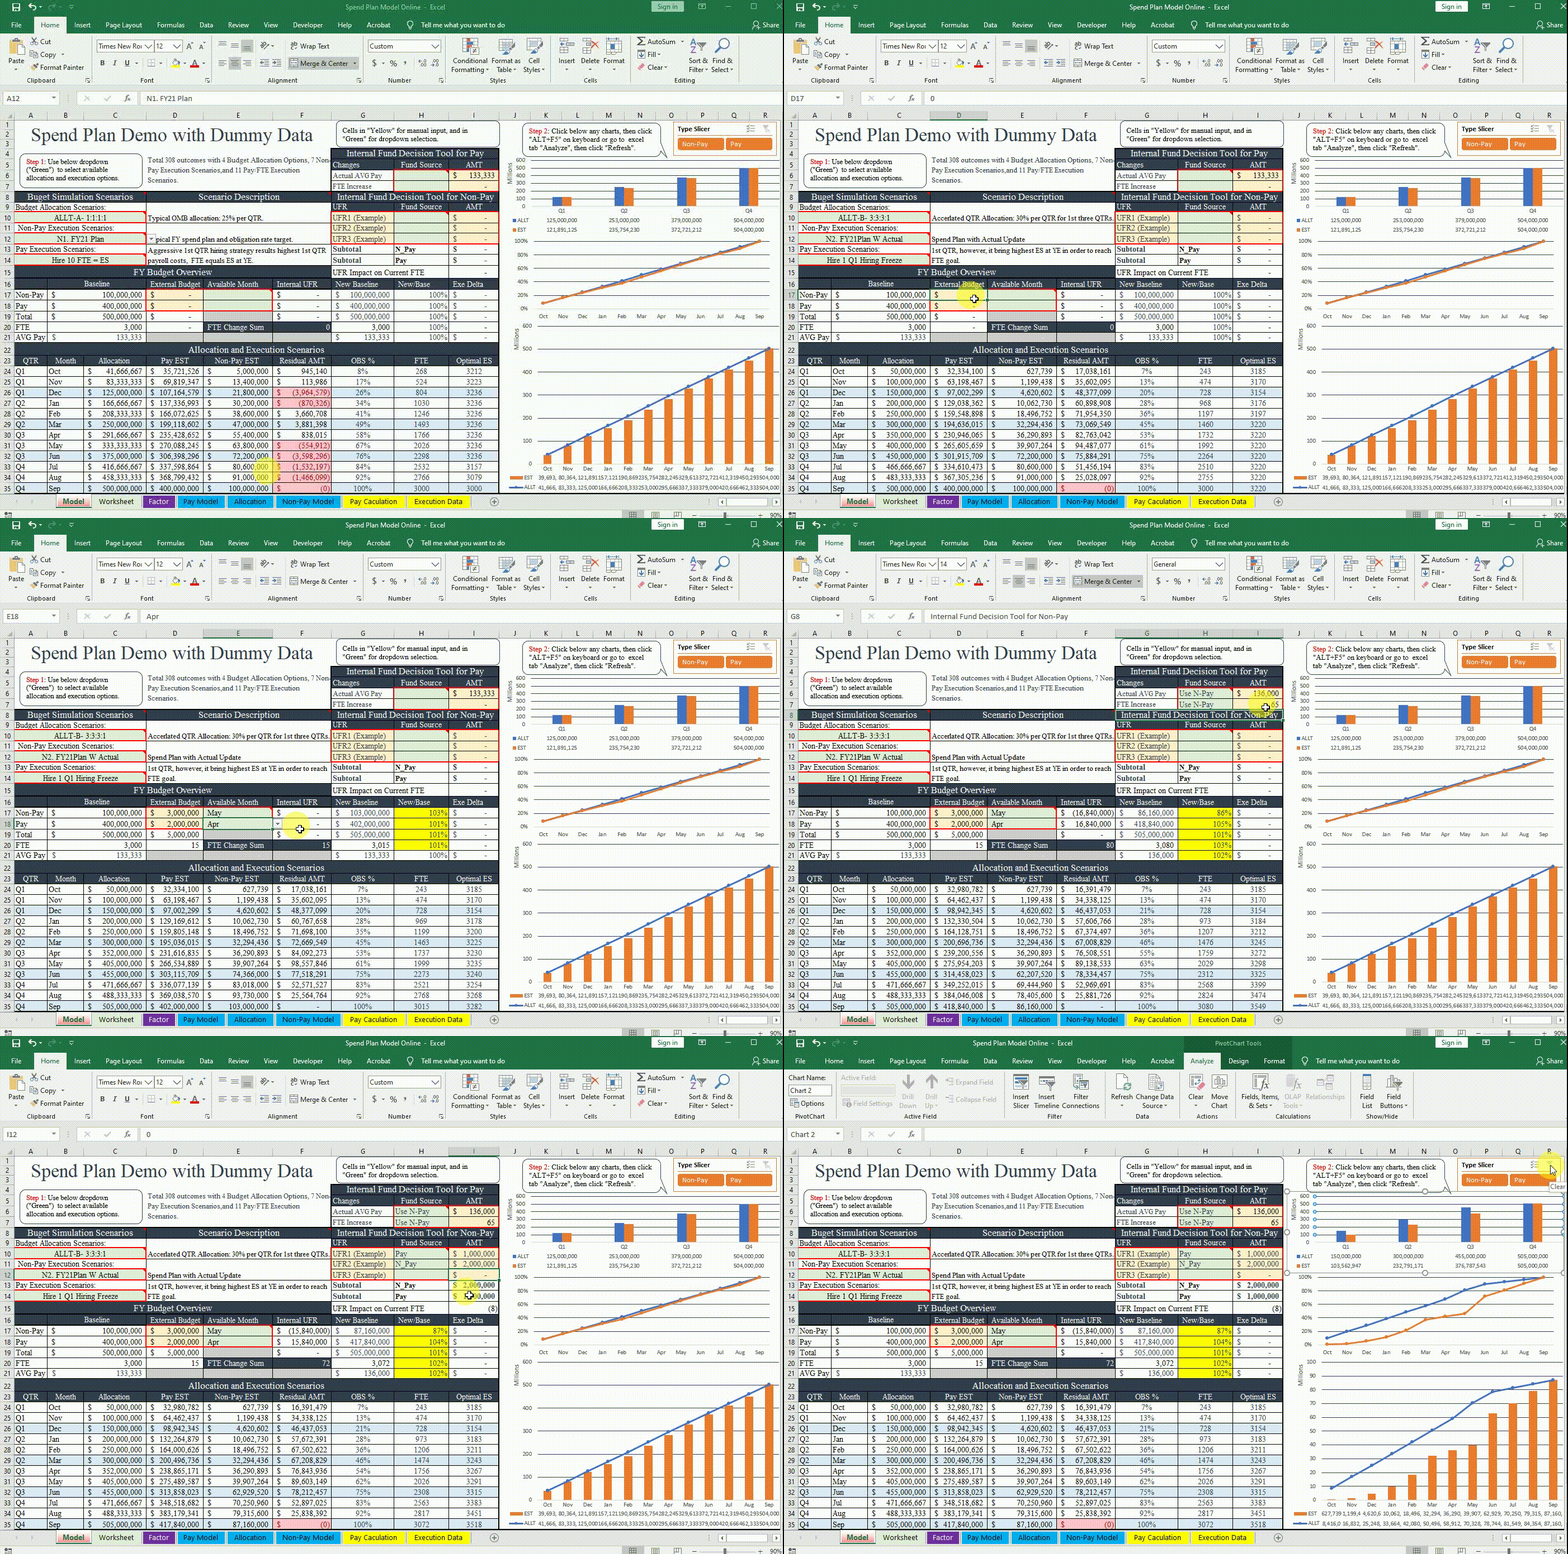
Federal Budget Operate Plan, AKA "Spend Plan", "Financial Plan", is the first phase of budget execution. Below excel-based scenario-driven self-balance spend plan model is a tool to plan and monitor budget before and during the year of the execution.
Chart 1: Federal Budget Operate Plan Model Demonstration

Chart 2: Federal Budget Operate Plan Model Process Map
Federal Budget Operate Plan TAB "Model" Detail Description by Section
- 1. The scenarios based allocation and execution combinations can produce over 300 outcomes, with pre-built 4 allocation options, 7 non-pay execution, and 11 pay execution scenarios.
- 2. The internal fund decision tools enable agency to conduct trade off analysis, shift funding priorities, funding new requirements, resolve execution deltas between budget costs and actuals, and maintain the balance of budget.
- 3. The “external request” portion enable users to adjust increased/decreased baseline number based on Department and Congress decision.
- 4. “The allocation and execution” provide detail information on execution outcome based on option selection, internal fund decision, and external adjustment.
- 5. The visualization allow users to gain clear understanding with each scenario outcome.
Chart 3: Federal Budget Operate Plan Model TAB "Model" Section Description
Federal Budget Operate Plan TAB "Model" Selected Excel Formulas and Functions
- 1: " = IFERROR(VLOOKUP(A10,Factor!AG:AH,2,0),“oops ") "
Formula used in “Model” to generate scenarios description based on user selection from dropdown menu in the section of “Budget Simulation Scenarios”. - 2: " = -IF(H6="Use N-Pay",(I6-B21)*B20,0)-IF(H7="Use
N-Pay",I7*G21,0)+I14 "
Formula used in “Model” to make adjustments on revised baseline based on the user input on “Fund Source” of pay and non-pay and “Amount” on “internal fund decision tool for Pay and for Non-Pay” - 3: " = IF(H6="Absorbed in Pay",-(I6-B21)*B20/G21,0)+IF(H7="Use
N-Pay",I7,0)-I14/G21+D20 "
Formula used in “Model” to make adjustments on FTE changes based on the user input on “internal fund decision tool for pay and non-pay”. - 4: "=IFERROR(SUMIFS(Worksheet!$F:$F,
Worksheet!$D:$D,Model!B24,Worksheet!E:E, Model!$A$10),0) "
Formula used in “Model” to pull selected data in the section of “Allocation and Execution Scenarios”
Federal Budget Operate Plan TAB "Worksheet" Selected Excel Formulas and Functions
Formula used in “Worksheet” to retrieve the monthly data based on the user selection on “Allocation”, “Pay”, and “Non-Pay” dropdown menu.
- 1. "=SUMIFS(Allocation!I:I, Allocation!D:D, Worksheet!D11,Allocation!E:E, Worksheet!E11, Allocation!B:B, Worksheet!B11) "
- 2. " = VLOOKUP(D26,'Non-Pay Model'!$C:$P,MATCH(Worksheet!E26,'Non-Pay Model'!$C$1:$P$1,0),0) "
- 3. " = VLOOKUP(D38,'Pay Model'!$A$91:$P$103,MATCH(Worksheet!E38,'Pay Model'!$A$91:$P$91,0),0) "
Federal Budget Operate Plan TAB "Non-Pay Model" Selected Excel Formulas and Functions
Use “IF” and “VLOOKUP” combinations to fill out the execution and plan data, if “VLOOKUP” has positive return from execution data report, then the monthly data field will contain actual execution data, otherwise, it will show plan data.
- 1. " = IF(VLOOKUP(C5,'Actual WS'!A:B,2,0)>0,VLOOKUP(C5,'Actual WS'!A:B,2,0),O5) "
Federal Budget Operate Plan TAB "Pay Model" Selected Excel Formulas and Functions
To calculate FTE QTR distribution by consider the working days by QTR and the FTE equivalent of the End Strength.
Chart 4: Federal Budget Operate Plan TAB "Pay Model"
Chart 5: Federal Budget Operate Plan TAB "Pay Weight"
Budget Allocation Scenarios:
- 1. ALLT-A- 1:1:1:1 - Typical OMB allocation: 25% per QTR.
- 2. ALLT-B- 3:3:3:1 - Accerlated QTR Allocation: 30% per QTR for 1st three QTRs.
- 3. ALLT-C- CR - CR Allocation: pro rata share of prior year agency budget.
- 4. ALLT-D- CR+APPN - Combination of CR ceiling and Appripriation with 1st Half Year under CR, 2nd under APPN
Non Pay exeuction scenarios are based on customized execution by months with consideration of historcal data, year to date current execution, and initial plan of execution.
- N1. FY21 Plan - Typical FY spend plan and obligation rate target.
- N2. FY21Plan W Actual - Spend Plan with Actual Update
- N3. His-Median (CR1) - Historical execution rate during CR period.
- N4. His-Min (CR2) - Historical execution rate during CR period with lowest obligation rate in 1st QTR.
- N5. His-Max (APPN) - Historical execution rate with budget enacted with highest obligation during 1st QTR.
- N6. His-AVG All - The average rate of all historical exeuction.
- N7. His-WGT CR+APPN - The weighted average of the historical exeuction rate.
Salary and expenses are driven by agency's hiring strategy and budget position, and 11 pay exeuction and hiring scenarios give agency options to find the option to balance its agency budget and working forces.
- Hire 1 Q1 Hiring Freeze: During hiring freeze, no new hires and lowest payroll cost in 1st QTR, however, it bring highest ES at YE in order to reach FTE goal.
- Hire 2 Q1 Essential Hire: Hire up to 40% of losses, result in lower payroll costs in 1st QTR.
- Hire 3 Q1 Flat: Hire strategy to only fill current vacant positions, lower payroll costs in 1st QTR, but higher than average ES on board at YE.
- Hire 4 Bell Grow: Hiring by QTR Ratio 2:3:3:2 will result in moderate 1st QTR cost and average ES grow at YE.
- Hire 5 Linear Grow: Linear Growth Hiring Strategy will result in moderate 1st QTR cost and average ES grow at YE.
- Hire 6 Log Grow: Logistic Curve Growth Hiring Strategy results in moderate 1st QTR cost and average ES grow at YE.
- Hire 7 Steady Grow: Hiring by QTR Ratio: 1:1:1:1 will result in moderate 1st QTR cost and average ES grow at YE.
- Hire 8 Inverted Bell Grow: Hiring by QTR Ratio: 3:2:2:3 will result in moderate 1st QTR cost and average ES grow at YE.
- Hire 9 All Grow in Q1: Aggressive 1st QTR hiring strategy results highest 1st QTR payroll costs, relative lower ES at YE.
- Hire 10 FTE = ES: Aggressive 1st QTR hiring strategy results highest 1st QTR payroll costs, FTE equals ES at YE.
- Hire 11 FTE > ES: Aggressive 1st QTR hiring strategy results highest 1st QTR payroll costs, ES at YE less than FTE.
