Portfolio
Federal Budget Spend Plan Model
Scenario-driven self-balance tool to plan and monitor Federal budget exeuction.
View Project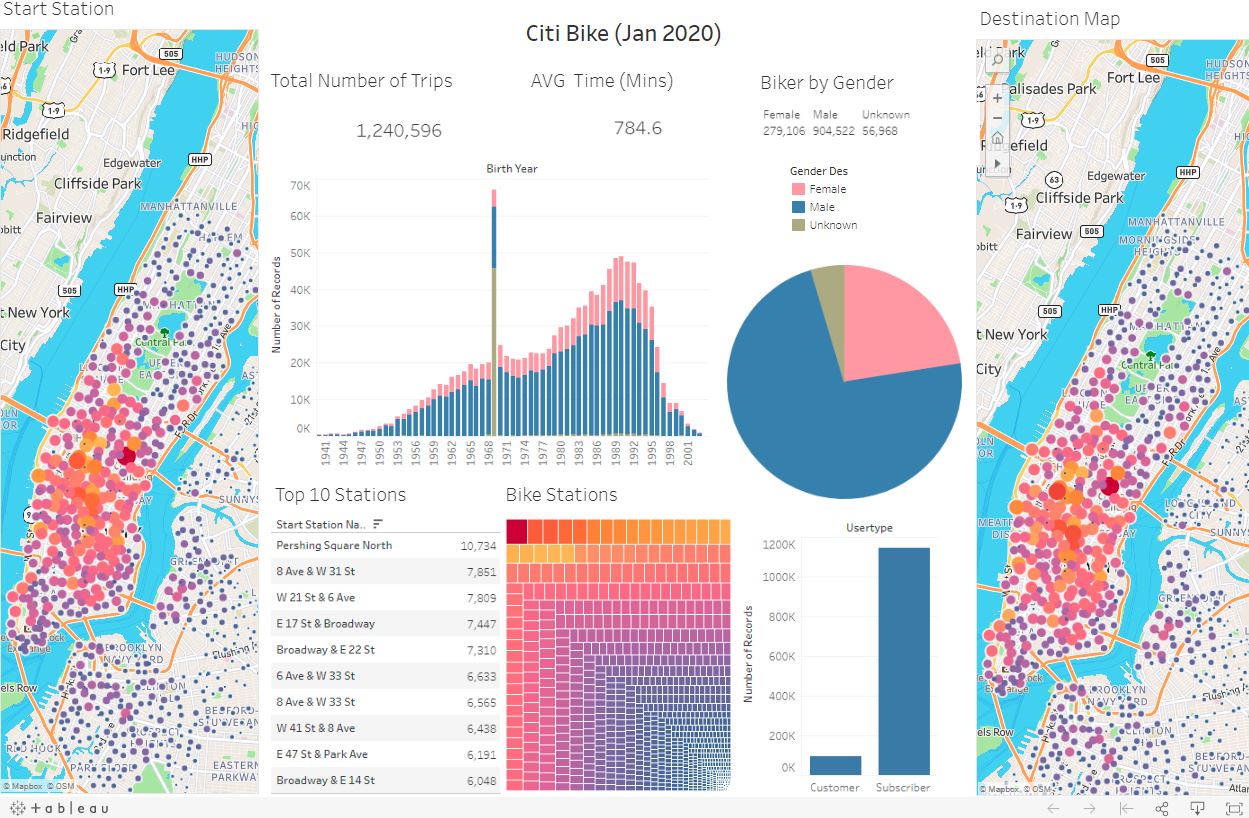
Tableau Citi Bike Usage Analysis
Show the usage of bike sharing program in New York City. Visulize the riding routes, the geographic locations and route, busiest bike stations.
View Project

VBA Code Examples for Excel
Use VBA functionalities to conduct data comparison, mining, analysis.
View Project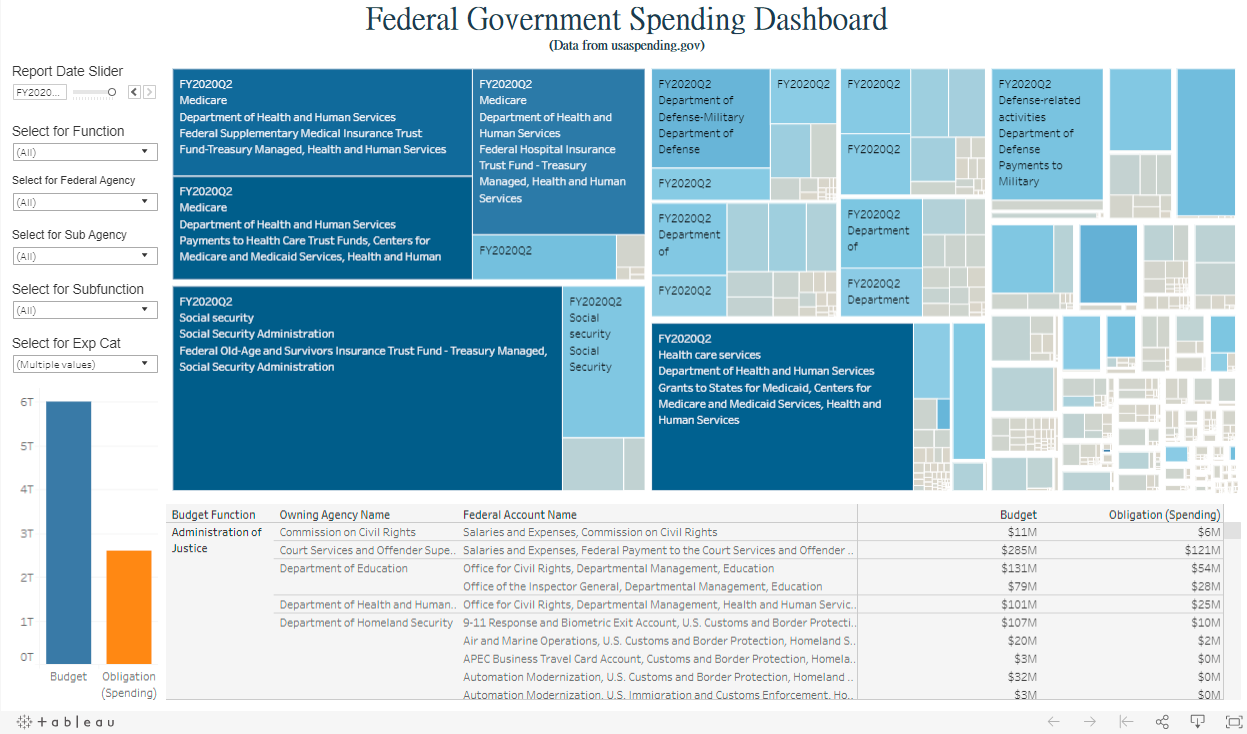
Federal Spending Dashboard
Tableau based dashboard to track federal budget and spending.
View Project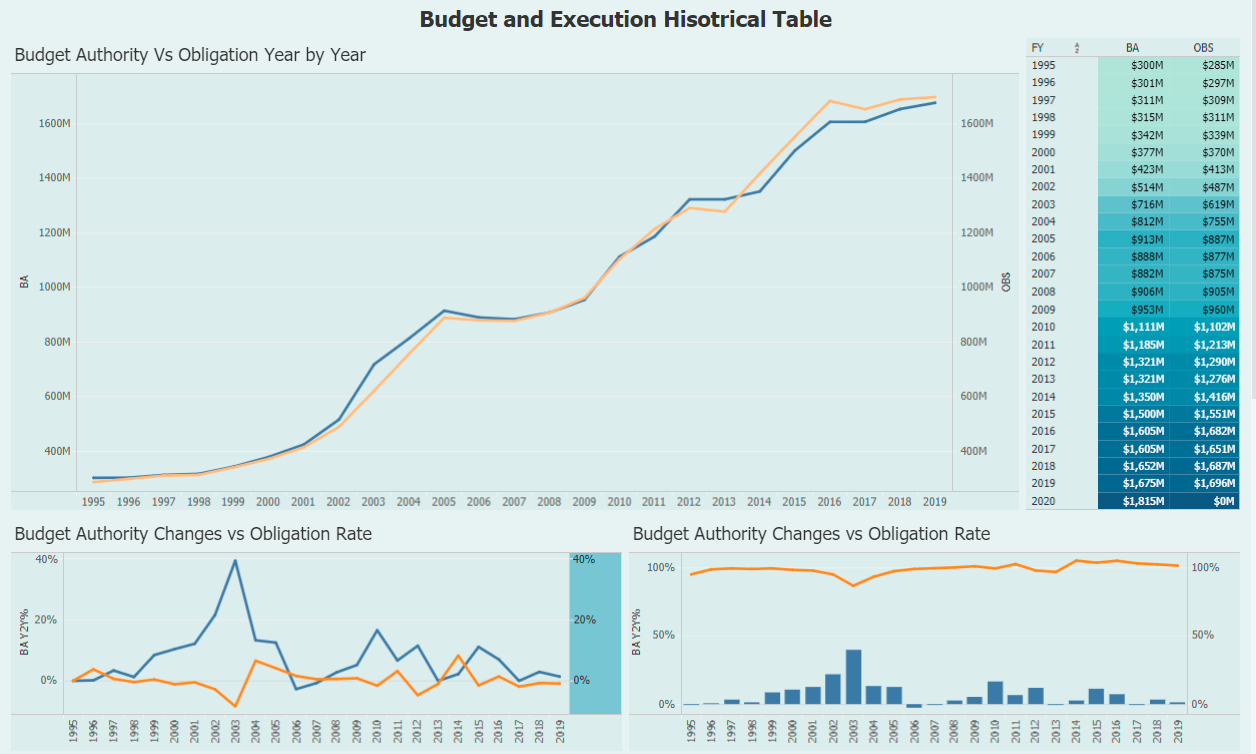
Budget Execution Dashboard
Tableau based dashboard to track and compare budget execution.
View Project
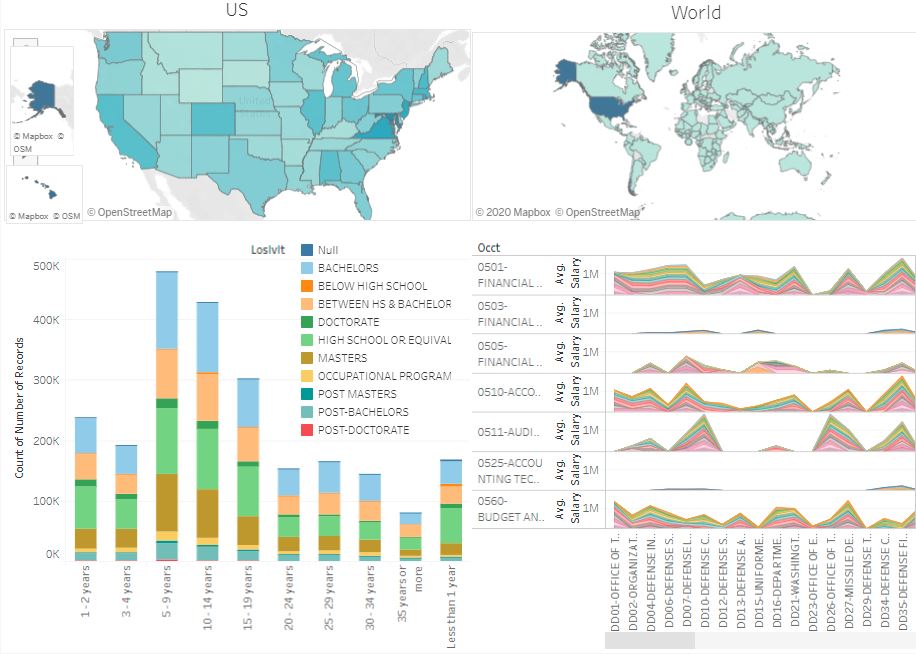
Tableau Federal Employee Average Salary
Show trend and distribution of Federal employment and it’s salary levels by geographic locations, education levels, and agencies.
Note: based on released FY 2018 data that is available to public.
View Project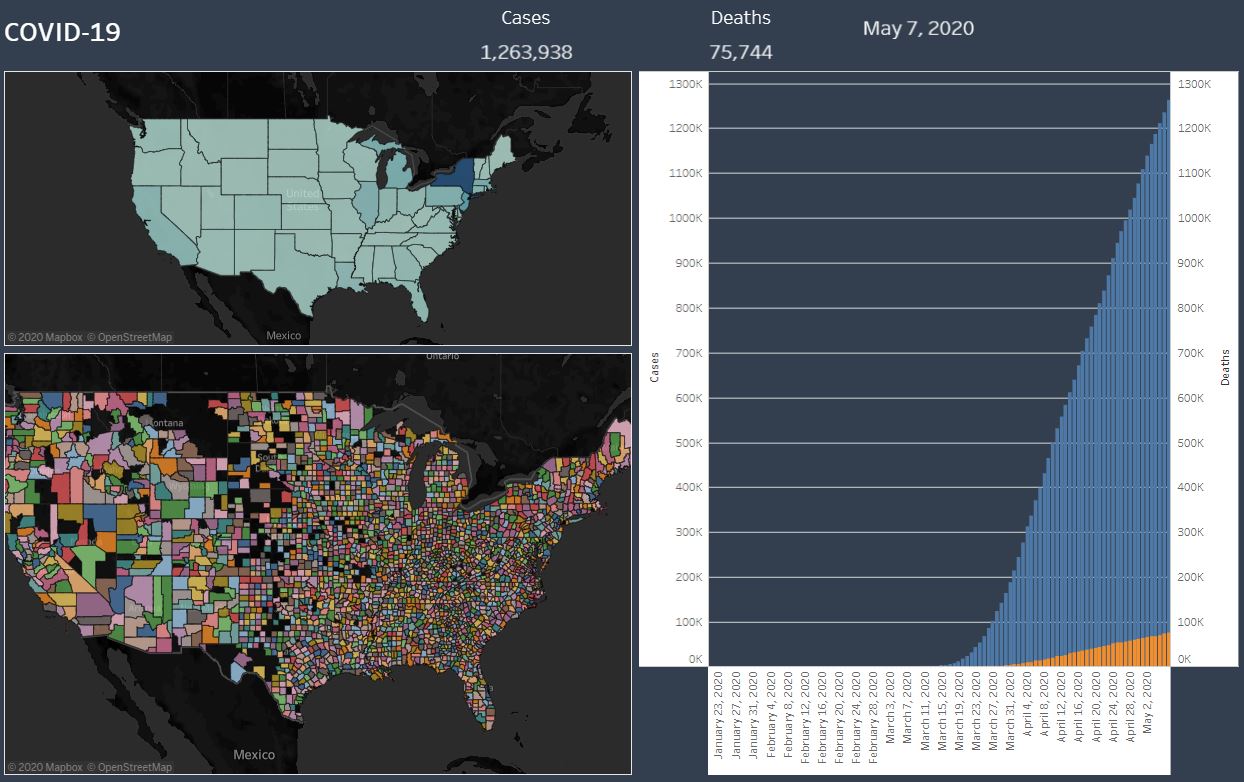
COVID19 Dashboard
This visualization shows COVID19 cases and deaths, and detail is showed at state and county level.
View Project
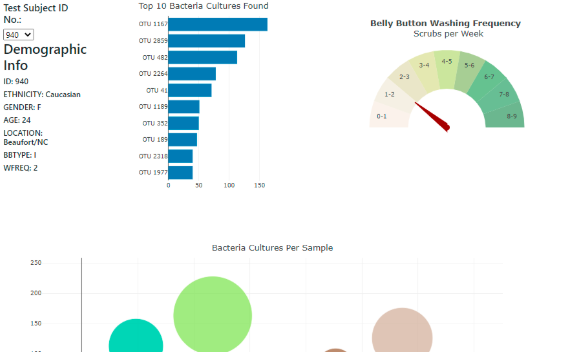
Belly Button Biodiversity Dashboard
Use JavaScript, CSS, D3, Plotly to build interactive dashboard
View Project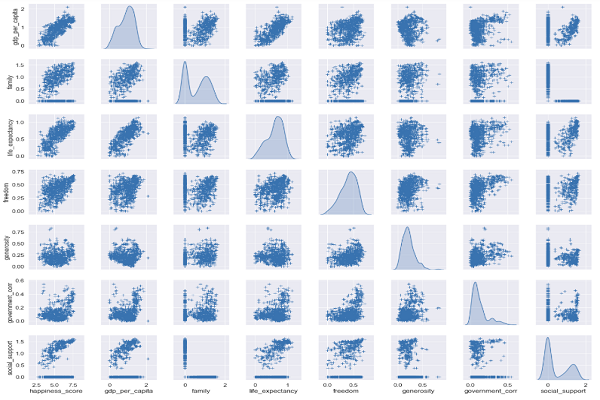
Machine Learning in Python
Use Python Machine Learning to conduct analysis to explore impacting factors
View Project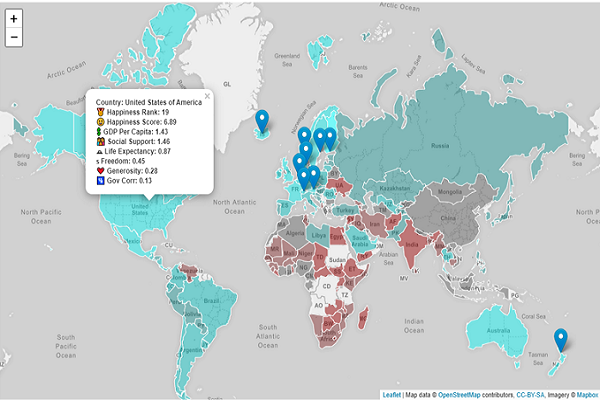
Python, JS D3, and Leaflet GeoMap
Use Python, JavaScript, D3, and Leaflet to conduct data mining, create map object, add data point, layers, pop-up, legend, and interactivity to the webpage.
View Project